Measuring Acoustic Absorption
Measuring Acoustic Absorption
Measuring acoustic absorption and why some acoustic products have absorption coefficients greater than 1.00
Generally, acoustic products have what is called an ‘absorption coefficient’. It is a figure which gives details of how effective they are over a range of frequencies. This mechanism is one of taking in sound energy, converting it to heat, and radiated less energy back into the room.
This figure ranges from zero (no sound absorption at all) to 1.0 where 100% of the sound that hits the material is absorbed.
If the figure is less than 1 it means that only part of the sound is being absorbed at a particular frequency with the remainder either being reflected back or passing through the material.
Sometimes product specifications also include an NRC (noise reduction coefficient) figure. This is an average figure of the mid-range absorption coefficients between 250Hz and 2Khz.
Occasionally absorption figures are stated in units called ‘Sabins’. These can be rather misleading as this refers to total absorption over an area. To convert Sabins into coefficient figures you need to divide the Sabin figure by the surface area of the material in question.
It is usually only ‘objects’ that quote Absorption in sabins (things like suspended cubes or rafts).
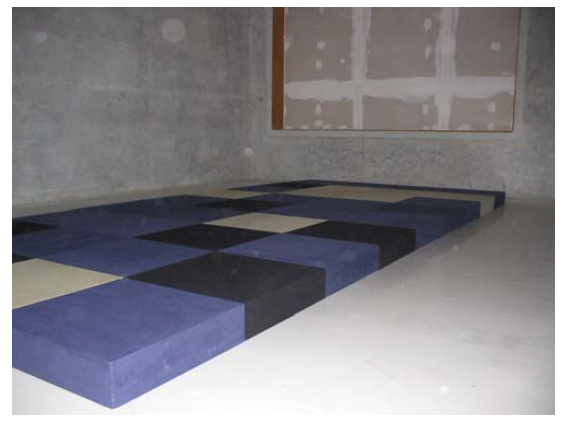
When measuring acoustic absorption, a sufficient area of material is placed in a reverberant room. Usually it is placed on the floor. The decay time is measured at different frequencies before and after the test material is installed.
The difference between these two measurements allows the absorption to be calculated.
Most absorption measurements are taken with the test material mounted directly on a surface. However, when material is spaced away from a reflective surface the low frequency performance is improved. Sometimes absorption figures obtained in this manner are included in product specifications (i.e. E-250 Mounting which means the product is mounted 250mm away from the surface).
It is not actually possible for a material to have an absorption coefficient of more than 1.00 but sound measurements can yield figures greater than 1.00.
The reason for this is that all materials have a certain thickness but the edges, which are not included in the surface area calculations, also absorb some of the sound.
As an example a 1200mm x 600mm x 100mm F/G Absorber has a front surface area of 0.72m² but including the four edges the overall ‘surface area’ increases to 1.08m² which is a 40% increase in surface area.
Generally it is often wise to assume that when absorption products are mounted ‘in-situ’ they may provide less than the published absorption figures.
Another thing to bear in mind is that manufacturers of profiled acoustic foams sometimes assume the acoustic data from the same thickness of material then proceed to cut away lots of material to achieve the ‘profile’ which means it’s highly unlikely the data will be anywhere near accurate because half of the initial material is missing. The profiled material should be tested separately.
British Standard BS EN ISO 11654 requires absorption information to be rounded to the nearest 0.05 with anything over 1.00 to be rounded down to 1.00.